Journals
Review by Dr. Andy Bush
Article: REMS Bone Scan (Echolight): What the Evidence Says About This DEXA Alternative
Author: Margaret Martin
Publication: MelioGuide
I am compelled to write this rebuttal to a recent article published in MelioGuide dated June 22, 2026. The author is an accomplished physical therapist with an established and respected reputation in the bone health community who has ventured into the realm of bone assessment with an opinion piece on the two most commonly used methods – DXA and REMS. I disagree with many of the claims made in the article. As an orthopedic surgeon with 30 years of experience, trained in densitometry and well-versed in REMS technology having performed more than 3000 scans over 5 years, I offer a review and critique of this article.
I have decided to break the review down into five sections representing the major topics discussed in the article.
First, a summary of REMS and DXA technologies:
DXA vs. REMS
The goal of assessing bone is not to determine whether you have osteoporosis. The goal is to determine the probability of fracturing. Bone mineral density (BMD) alone is not a good screening tool [1]. Fracture risk is best determined by assessing the strength of the bone – structurally strong bone is fracture-resistant and structurally weak bone will break [2-7].
DXA is a method of assessing BMD using x-ray. DXA does not show you the “actual status of your bone” but is an indirect method that determines the density (BMD) of bone by measuring how well x-ray beams are blocked by bone. DXA is performed by a specialized x-ray machine that can measure how much x-ray is generated and how much is collected after the x-ray beams pass through you. That difference, the attenuation differential, is then processed using complex mathematical and statistical analyses to yield a BMD value [8]. This method is inherently flawed; the computer does not “know” what is blocking the x-ray beam. Therefore, bone spurs, broken bone, calcifications in soft tissue, calcium supplements, and other dense internal objects such as spinal hardware will adversely affect DXA-derived BMD. Also, anything in the capture grid that is dense enough to block the x-ray beam will also affect the DXA results. It is up to the examiner or person reading the DXA to determine if positioning is correct or if artifacts are affecting the results. Unfortunately, most DXA reports no longer include the image page.
DXA-derived BMD is converted into T-scores using several statistical databases; spine conversion uses manufacturer-specific proprietary databases and hip conversion utilizes the NHANES (CDC) database. Therefore, DXA spine results cannot be directly compared to each other if different manufacturers’ machines were used.
REMS is a quantitative ultrasound technology that can measure, assess and report specific and clinically significant characteristics of human bone in compliance with the WHO established criteria for the diagnosis of osteoporosis [9,10]. The development of REMS technology made it possible to sonographically assess the lumbar spine and proximal femurs that prior to REMS, could only be measured by DXA. What distinguishes REMS from DXA is the capacity of REMS to assess bone structure and therefore determine bone strength to predict fracture risk [11,12].
During a REMS assessment, ultrasound waves (3.5 MHz) are pulsed into the body using a handheld piezoelectric transducer positioned over the spine and hips. The RF signals are generated by rows of lead zirconate titanate (PZT) crystals. The RF signals are sequentially pulsed into the target tissues, and then the raw, backscatter signals are captured. Unlike conventional qualitative ultrasound which generates an image, REMS quantitatively analyzes the frequency spectrum of these collected RF signals to determine the bone microarchitecture.
In simpler terms – ceramic crystals in the hand-held probe emit an ultrasound wave when an electric current is passed through the probe. Some of the sound waves will pass right through the person being examined and hit the table. Those are not the waves we want. We want the waves that have come back to the probe after they have hit and interacted with the target bones in the spine and hips. Therefore, the echo of the bone is being collected. The echo returning from the bone was modified by the bone – similar to when you shout into a canyon. Your echo will repeat what you shouted, but it does not sound like you. The canyon has modified your voice. In a similar way, your bone modifies the REMS sound wave. That modified sound wave carries information about the structure of your bones. Multiple research studies documented that when cadaver bone of different quality is hit with a sound wave the echo from the strong bone will be very different than the echo from the weak bone. To determine if your echo is coming from strong bone or weak bone, the echo coming from your bone is compared to an average sonographic profile of strong bone (the echo from a group of individuals with no fractures) and to an average sonographic profile of weak bone (the echo from a group of individuals who have sustained fragility fractures). The results are reported as a Fragility Score (FS). The larger the FS value, the weaker the bone and the higher the fracture risk.
In REMS, the BMD is determined in a way that is completely independently from the FS. To determine BMD, the collected bone echoes are analyzed against a proprietary database of reference sound waves with BMD values ranging from “normal”, to “osteopenia” to “osteoporosis” that were determined by research-caliber DXA examinations. Yes, REMS-derived BMD values are based on a data base of DXA-derived BMD values!!! An Osteoporosis Score (OS) is then generated. The OS is used to calculate the BMD using a series of linear equations. T-score and Z-score values are then derived from the NHANES database for the spine and the hips. This approach has been validated across multiple clinical studies [11-15].
REMS bone assessment is very accurate [16,17]. Multiple analytical processes are performed to validate the data collected prior to analysis, eliminating many artifacts that affect DXA. The collected echoes undergo a sequence of filtering, identification, enhancement, amplification, and morphologic evaluation. Once the frames of the sonographic dataset have gone through the initial validation steps, the identified bone interfaces are assessed. If found to be sufficient to yield a statistically reliable result, the analysis proceeds and a final report is generated. If the filtering process fails to yield the appropriate bone profile, the threshold signal-to-noise ratio is not achieved and/or there is insufficient information to be statistically significant, a report will not be generated. The examination will have to be repeated. The process is not “just two algorithms” but a complex series of processes performed by AI.
Ultrasound analysis of bone is comparable to a CT analysis [18,19]. Femoral head specimens were obtained from hip replacement surgery. The femoral head specimen was analyzed first by CT. The section representing the middle cut through the femoral head was selected for analysis. Qualitatively, the x-ray resembles a pizza – the image is round; the outer layer of cortical bone looks like the crust of the pizza and the trabecular bone looks like the cheese and the sauce. On that image of bone, it was visually obvious that the cheese was not put on evenly – there were areas of the pizza with more cheese; other areas had less cheese. This uneven distribution of cheese represents an uneven distribution of the trabecular bone in the femoral head. CT is capable of determining bone distribution. The x-ray was sectioned into 30 slices. The CT was used to measure the cheese to sauce ratio – the bone volume to total volume ratio (BV/TV). The BV/TV of every slice was put on a graph. Next, each slice of bone was then assessed with ultrasound and the results were also applied to the BV/TV graph. The two graphs were statistically identical. These studies establishing that ultrasound could determine bone structure at the level of accuracy of a CT scan. REMS does not just measure how well you block an x-ray beam. It has the capacity to determine the structure of bone on par with CT.
REMS uses multiple filtering steps to identify the target bone and has the capacity to assesses bone structure comparable to a CT scan. The accuracy and capacity at which REMS assess bone unequivocally establishes that DXA and REMS are completely different tests.
The article rebuttal:
1 – Can REMS and DXA BMD results be compared?
The answer is a “qualified” yes. The REMS-derived BMD and DXA-derived BMD values should not be compared quantitatively but they can be assessed qualitatively. REMS and DXA are both methods of densitometry that comply with the standards set by the WHO. Multiple peer-reviewed, literature-based studies have documented that REMS and DXA BMD determination are comparable [16, 17]. That should be of no surprise; REMS-derived BMD values are based on a database built by a research-caliber DXA! [9,10] So, why the controversy? Unfortunately, most clinically available DXA scans are not research-caliber. Therefore, in general everyday use REMS and DXA BMD values will often be dissimilar (discordant). In many situations, DXA examinations will be inappropriately done due to technical error, artifactual error, calibration error, and/or suboptimal positioning. DXA has a 40-50% error rate in determining BMD in the general clinical setting [20].
Also, since DXA-derived BMD is converted to T-scores using the different manufacturers’ proprietary databases, DXA scans performed on different manufacturers’ machines cannot be quantitatively compared. There is at least a 10% discrepancy between the Hologic and GE spinal databases [20].
DXA cannot determine bone structure – unless it has the TBS software. If TBS is not available, a DXA scan can only estimate BMD. The recent emphasis by the DXA community on TBS is testimony to the fact that bone structure is the reliable method of predicting fracture risk [21].
So, why was BMD chosen to try to determine fracture risk?
Density, which is a physical property of bone, was chosen to assess the skeleton over 30 years ago because bone density could be determined by x-ray. But density was not the best choice. Measuring bone elasticity is better way to determine fracture risk. Elasticity, which is another physical property of bone, is an engineering term used to describe the ability of a material to withstand an applied force and not fail. To measure elasticity a section of bone would have to be surgically removed and sent to a laboratory to undergo physical testing. Obviously, to remove a section of bone for laboratory analysis was not feasible or ethical. At that time, the use of x-ray to measure density provided the only non-invasive method to measure a physical property of bone that had some relevance in determining skeletal frailty [1] and therefore, fracture risk.
Bone strength is a mechanical property. Mechanical properties describe how materials behave as a result of the combined contributions of all of the physical properties of the material. Density is only one of multiple physical properties that determine the mechanical properties of a structural material. Measuring density alone cannot accurately or reliably determine how a material will behave when a loading force is applied [1,22,23] since there are so many more physical properties that also contribute to mechanical behavior. Therefore, measuring BMD is not a reliable way to determine if a bone will break [1]. The reported statistic that 50% of all fragility fractures happen in individuals who do not have osteoporosis confirms that measuring bone density is an unreliable way to determine fracture risk [1,24,25]. Determining bone strength is now known to be the most important aspect of diagnostic bone assessment – strong bone is fracture-resistant; weak bone breaks.
A simple example that clearly demonstrates the difference between using density vs. structure in determining fracture risk is comparing a piece of blackboard chalk to a pencil. The blackboard chalk is significantly denser than a pencil – put both in a bucket of water and the chalk promptly sinks whereas the pencil floats. Now drop the chalk and pencil. The chalk shatters when it hits the ground, and the pencil bounces. What just happened? According to our current system of determining fracture risk by emphasizing bone density the chalk was not supposed to break because it is very dense. But it shattered. The pencil did not break, even though the pencil is not as dense as the chalk. Wood is structurally stronger than chalk and therefore the pencil is resistant to breaking. We build houses out of wood; no one would consider building a house out of chalk.
DXA currently is considered to be the “gold standard” because it has been around for 30 years – unchanged and unimpeded by progress and technical innovation. It is true that most physicians are not aware of REMS and do not understand the technology and therefore do not use it for treatment recommendations. However, the DXA golden chalice is cracking, and the gold plating is flaking off. The importance of bone structure assessment in determining bone strength will soon be better understood by the medical community. The concept that weak bone breaks and strong bone is fracture-resistant will replace BMD as the correct way to determine fracture risk. The DXA “gold standard” will tarnish when exposed to the light of modern technology and information.
Although REMS is still considered to be a novel technology for assessing bone structure, REMS holds potential to have a transformative effect on the field of bone health.
2 – DXA vs REMS – small bones – and statistics
Are the T-scores determined by indirect bone assessment (DXA and REMS) biased by bone size? YES!
How and why? – There are two areas for potential bias:
1 – the method of measuring BMD (the physics of how the measurement is made)
2 – the conversion of the measured BMD to a T-score.
DXA is affected by bone size bias in both aspects of determining a T-score. The process of converting a 3-dimensional object into a 2-dimensional diagnostic image (x-ray) is based on sectioning the 3-D object into multiple slices (tomography) which allows each slice to be represented as a 2-D cross-section. The BMC (bone mineral content) of the cross-sectional image will then determine the BMD as gr/cm2 – a surface area measurement determined by the cross section of the bone. A normal BMC and BMD are defined by benchmark values determined from the bone mass of an “average” size female. Therefore, the cross section of smaller bones will have less BMC than the benchmark bone mass of an average size woman and therefore will be determined to be deficient (osteopenia or osteoporosis) whereas bones larger than the average benchmark will be determined to have more than sufficient bone mass (normal) [20].
The physics of REMS does not bias bone measurement based on size. The echo coming from bone will have an amplitude spike (maximum wave size) corresponding to the interaction of the soundwave with the hard cortical surface of the bone. The developers of REMS determined that when the amplitude of the penetrating echo is 15% of the maximum amplitude at the bone surface the depth of penetration will target the correct trabecular bone regardless of bone size. The physics of REMS prevents bone size bias [15,16].
The conversion of BMD to a T-score value, whether determined by REMS or DXA introduces bias. The benchmark used to determine if a BMD value is good or bad is the average BMD from a normative database of 20-29 yo Caucasian females. That database represents the anthropomorphic (physical) qualities of an average size woman in the general population. A smaller person will have smaller bones and therefore, less bone mass than the average. They will be considered to be bone deficient and the diagnoses of osteopenia or osteoporosis will be inappropriately assigned. Both DXA and REMS have a bias in the conversion of BMD to T-scores.
3 – Cited Literature: Bobelyak, et al., and Chan, et al.
Recent articles [Bobelyak, et al. and Chan, et al.] [28,29] raised concerns about REMS. Academic discourse is necessary in the development and acceptance of new technologies and REMS needs to be able to withstand academic scrutiny based on facts and accurate information. Unfortunately, neither Bobelyak, et al., or Chan, et al., meet that academic threshold.
Bobelyak, et al., documented that they were able to measure the BMD of the femoral neck in a group of selected patients who were indicated for and underwent successful Total Hip Arthroplasty (THA) surgery. The published results indicated that they were able to obtain BMD measurements of the femoral neck utilizing REMS prior to and following THA. Based on how REMS collects, filters, and analyzes data, it is impossible to perform a REMS examination following THA surgery. Bobelyak et al., due to the questionable REMS assessment lacks academic credibility and should be pulled from publication.
Chan, et al., investigated the significance of clinically relevant factors (CRF) such as age, height, and weight in determining fracture risk in REMS-determined BMD and FS. The demographic input prior to either a DXA or REMS examination includes height, weight, and age as well as gender, race, and age of menopause. The CRFs contribute to the final fracture risk determined by either DXA or REMS [9,10,30,31]. Based on their limited study of 5 individuals, Chan, et al., concluded that REMS-derived BMD and FS were not the result of the sonographic assessment of the bone, but were the results of the demographic input by the algorithms incorporated into the REMS software.
I applaud Chan, et al., for bringing attention to an issue that experienced REMS users and Echolight Corporation are aware of. The REMS-derived FS over-estimates fracture risk for older individuals who are healthier than average. Unfortunately, their conclusion that REMS “functions primarily as a sophisticated, demographically weighted algorithm to predict DXA BMD,” (a “fancy” version of FRAX) is wrong and is not supported by the experiment they performed. The conclusion was made without consideration of the inherent age bias of the distribution of fracture risk statistics represented on the graph. The accuracy of predicting fracture risk is high in the central region of the graph (78-81% AUC) [12]; as expected, accuracy decreases as the left-hand and right-hand graph margins are approached.
This table compares multiple studies that reported the accuracy of REMS in determining fracture risk:
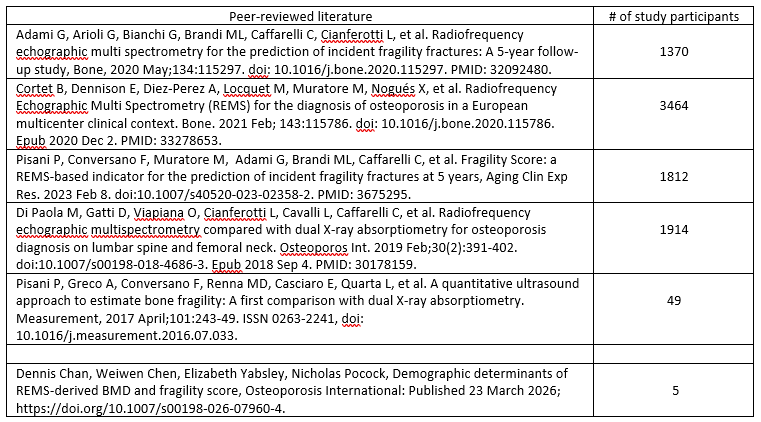
As a REMS user, I agree that age-bias affects Fragility Score values in certain demographic cohorts. However, the conclusion drawn by Chan, et al., that “[REMS] final output is almost entirely tethered to the demographic inputs regardless of the underlying ultrasound signal,” is incorrect. To draw that conclusion from a study based on 5 participants that stands in direct contradiction of multiple peer-reviewed studies involving thousands of participants is inappropriate and does not meet accepted academic standards. Although published in a prestigious journal, Chan, et al., is no more than a case report and should be treated in that manner. It does not meet the criteria to be considered substantive.
4 – FRAX and REMS
The format of the fracture risk assessment graphs located on the 2nd page of a standard REMS report were prepared in a manner to be consistent with how fracture risk data is presented in FRAX [11]. However, REMS-DERIVED BMD CANNOT BE USED IN THE FRAX ALGORITHM!!!!! The FRAX algorithm does not accept the REMS BMD value [32]. A standard REMS assessment reports a 5-year fracture risk value in lieu of FRAX.
5 – Backlash to Bobelyak, et al., and Chan, et al.
These articles definitely started a debate but not for the right reasons. Both studies are substandard and should not have been published in the caliber journal where they are currently published. Bobelyak, et al., was based on a flawed REMS examination and needs to be withdrawn and completely reconsidered. Chan, et al., was a case study of 5 subjects. The issue raised by Chan, et al., is omnipresent and presents the same challenge in all systems that rely on the statistics of a general population database to determine fracture risk in a population that is a “statistical outlier.”
There have been rebuttals from multiple users of REMS. One response was an official Echolight response [33]. It is expected that Echolight will challenge papers that misrepresent REMS, and the individuals authoring those challenges have a relationship with Echolight. However, other individuals including the organization IIMHE that represents multiple REMS users who do not have financial ties to Echolight.
As a disclaimer, I also have no financial ties with Echolight. My decision to use, promote, and defend the use of REMS is based on my understanding of the value of REMS in bone health and the still untapped potential of REMS to be the transformative technology of bone health.
The author takes issue with the individuals who use REMS challenging Bobleyak, et al., and Chan, et al., suggesting that users of REMS cannot be unbiased. That does not make any sense. Who are the experts in REMS? – the individuals who use it routinely and understand its strengths and weaknesses. Why would you embrace a critique performed by someone who has limited knowledge on a topic? Between my REMS assessments and the ones performed by the members of IIMHE, there are well over 10,000 studies. The individuals completing thousands of REMS assessments are who you want to be writing articles, assessing, critiquing and making recommendations for REMS and educating the individuals who want to learn more about it.
Conclusion
The pursuit of knowledge should remain open to all with intellectual curiosity and the desire for academic growth. Assessments of new technologies are important for academic growth but should be performed by those with the most experience and understanding. Having limited knowledge or experience with a new technology could lead to misrepresentation of that technology and the spreading of misinformation.
The article REMS Bone Scan (Echolight): What the Evidence Says About This DEXA Alternative has some factual information but, it does not meet academic standards based on its misrepresentation of REMS technology and its citing controversial and challenged literature. I would encourage the author to learn more about REMS by either consulting with the manufacturer, Echolight Corp. and/or any one of the individuals who have performed thousand scans over the course of the past several years. These are the individuals who can provide education and insight to gain a better understanding of this technology to best serve the bone health community to provide correct, truthful and therefore useful information.
Bibliography
1. Harvey N C, Al‑Daghri N, Beaudart C, Brandi M-L, Burlet N, Campusano C, et al. Barriers and solutions for global access to osteoporosis management: a Position Paper from the International Osteoporosis Foundation, Osteoporosis International (2025) 36:1495–1507. https://doi.org/10.1007/s00198-025-07628-5
2. Curry J. Measurement of the Mechanical Properties of Bone: A Recent History. Clin Orthop Relat Res. 2009 March 14:467(8):1948-1954. doi:10.1007/11999-009-0784-z
3. Seeman E. Bone’s material and structural strength, Current Opinion in Orthopedics, Sept 2007;18(5):494-498. doi:10.1097/BCO.0b013e3282a9c162
4. Hart NH, Nimphius S, Rantalainen T, Ireland A, Siafarikas A, Newton RU. Mechanical basis of bone strength: influence of bone material, bone structure and muscle action. J Musculoskelet Neuronal Interact. 2017 Sep 1;17(3):114-139. PMID: 28860414; PMCID: PMC5601257.
5. Boskey A. Using bone quality to assess fracture risk, AAOS Now, American Academy of Orthopedic Surgery, July 1, 2011.
6. Paschalis E, Mendelsohn R, et al. Infrared Assessment of bone quality – a review, Clin Orthop Relat Res (2011) 469: 2170-2178.
7. Elizabeth A Zimmermann, Bjo¨rn Busse, Robert O Ritchie, the fracture mechanics of human bone: influence of disease and treatment International, Bone & Mineral Society Bonekey Reports 4, Article number: 743 (2015) doi:10.1038/bonekey.2015.112. www.nature.com/bonekey
8. IAEA, Dual energy X ray absorptiometry for bone mineral density and body composition assessment, 2010; pg. 79; IAEA human health series, ISSN 2075–3772; no. 15: STI/PUB/1479; ISBN 978–92–0–110610–0.
9. Conversano F, Franchini R, Greco A, Soloperto G, Chiriacò F, Casciaro E, et al. A novel ultrasound methodology for estimating spine mineral density. Ultrasound Med Biol. 2015 Jan;41(1):281-300. doi: 10.1016/j.ultrasmedbio.2014.08.017. Epub 2014 Nov 15. PMID: 25438845.
10. Casciaro S, Peccarisi M, Pisani P, Franchini R, Greco A, De Marco T, et al. An Advanced Quantitative Echosound Methodology for Femoral Neck Densitometry, Ultrasound Med Biol. 2016 Jun;42(6):1337-56. doi: 10.1016/j.ultrasmedbio.2016.01.024. Epub 2016 Mar 28. PMID: 27033331.
11. Pisani P, Greco A, Conversano F, Renna MD, Casciaro E, Quarta L, et al. A quantitative ultrasound approach to estimate bone fragility: A first comparison with dual X-ray absorptiometry. Measurement, 2017 April;101:243-49. ISSN 0263-2241, doi: 10.1016/j.measurement.2016.07.033.
12. Pisani P, Conversano F, Muratore M, Adami G, Brandi ML, Caffarelli C, et al. Fragility Score: a REMS-based indicator for the prediction of incident fragility fractures at 5 years, Aging Clin Exp Res. 2023 Feb 8. doi:10.1007/s40520-023-02358-2. PMID: 3675295.
13. Aldolfo Diez-Perez, et al, Radiofrequency Echographic Multispectrometry for the in-vivo assessment of bone strength: state of the art – outcomes of an expert consensus meeting organized by the European Society for Clinical and Economic Aspects of Osteoporosis, Osteoarthritis and Musculoskeletal Diseases (ESCEO), Aging Clinical and Experimental Research (2019) 31: 1375-1389.
14. Nicholas R Fuggle, Jean-Yves Reginster, Nasser Al-Daghri, Olivier Bruyere, Nansa Burlet, Claudia Campusano, Cyrus Cooper, Adolfo Diez Perez, Philippe Halbout, Tullio Ghi, Jean-Marc Kaufman, Andreas Kurt, Radmila Matijevic, Regis P Radermecker, Sansin Tuzun, Nicola Veronese, Rene Rizzoli, Nicholas C Harvey, Maria Luisa Brandi, Radiofrequency Echographic Multi Spectrometry (REMS) in the diagnosis and management of osteoporosis: state of the art; Aging Clinical and Experimental Research (2024) 36:135; https://doi.org/10.1007/s40520-024-02784-w.
15. D. Ciardo, P. Pisani, F. A. Lombardi, R. Franchini, F. Conversano, S. Casciaro, Incident Fracture Risk Prediction Using
The Fragility Score Calculated by Lumbar Spine Radiofrequency Echographic Multi Spectrometry (Rems) Scans, Ann Rheum Dis: first published as 10.1136/annrheumdis-2021-eular.2311 on 19 May 2021. http://ard.bmj.com/ on December 7, 2021.
16. Adami G, Arioli G, Bianchi G, Brandi ML, Caffarelli C, Cianferotti L, et al, Radiofrequency echographic multi spectrometry for the prediction of incident fragility fractures: A 5-year follow-up study, Bone, 2020 May;134:115297. doi: 10.1016/j.bone.2020.115297. PMID: 32092480.
17. Cortet B, Dennison E, Diez-Perez A, Locquet M, Muratore M, Nogués X, et al. Radiofrequency Echographic Multi Spectrometry (REMS) for the diagnosis of osteoporosis in a European multicenter clinical context. Bone. 2021 Feb; 143:115786. doi: 10.1016/j.bone.2020.115786. Epub 2020 Dec 2. PMID: 33278653.
18. Peccarisi M, De Marco T, Conversano F, Pisani P, Spedicato L, Greco A, et al. In-vitro study of human proximal femur microstructure: analysis of the relationship between micro-computed tomography data and quantitative ultrasound parameters, IET Sci. Meas. Technol., 2016, Vol. 10, Is. 3, pp. 193–199, doi: 10.1049/iet-smt.2015.0041www.ietdl.org.
19. Tommaso De Marco, Marco Peccarisi, Francesco Conversano, Antonio Greco, Samanta Chiozzi, Fabio De Pascalis, Sergio Casciaro, A new approach for measuring the trabecular bone density through the echosound backscattering: An ex vivo validation on human femoral heads; Measurement 87 (2016) 51–61; http://dx.doi.org/10.1016/j.measurement.2016.03.011
20. ISCD Clinician Course, Lecture 6 - Can you trust this DXA report, US Version, December 2020.
21. Silva BC, Leslie WD, Resch H, Lamy O, Lesnyak O, Binkley N, et al. Trabecular bone score: a noninvasive analytical method based upon the DXA image. J Bone Miner Res. 2014 Mar;29(3):518-30. doi:10.1002/jbmr.2176. Erratum in: J Bone Miner Res. 2017 Nov;32(11):2319. PMID: 24443324.
22. Leslie WD, Majumdar SR, Morin SN, Lix LM. Why does rate of bone density loss not predict fracture risk? J Clin Endocrinol Metab. 2015 Feb;100(2):679-83. doi:10.1210/jc.2014-3777. Epub 2015 Jan 22. PMID: 25611114.
23. Garg MK, Kharb S. Dual energy X-ray absorptiometry: Pitfalls in measurement and interpretation of bone mineral density. Indian J Endocrinol Metab. 2013 Mar;17(2):203-10. doi:10.4103/2230-8210.109659. PMID: 23776890; PMCID: PMC3683192.\
24. Unnanuntana A, Gladnick BP, Donnelly E, Lane JM. The Assessment of Fracture Risk, J Bone Joint Surg Am. 2010; Mar;92(3):743-753. doi:10.2106/JBJS.I.00919
25. Wainwright SA, Marshall LM, et al. Hip fracture in women without osteoporosis, J Clin Endocrinol Metab, (2005) 90:2787-2793. https://doi.org/10.1210.jc.2005-1568
26. Zimmermann EA, Ritchie R. Bone as a Structural Material, Advanced Healthcare Materials, 2015; 4;(9):1287-1304, https//doi.org/10.1002/adhm.201500070
27. Murphy W. Structure Stability, International Journal of Solids and Structures. 37 (2000); 55-67.
28. Maryan Bobelyak, Jan Vaculik, Jan J. Stepan, Bone mineral density assessment using Radiofrequency Echographic Mult Spectrometry (REMS) in patients before and after total hip replacement, Osteoporosis International, https://doi.org/10.1007/s00198-025-07685-w
29. Dennis Chan, Weiwen Chen, Elizabeth Yabsley, Nicholas Pocock, Demographic determinants of REMS‑derived BMD and fragility score, Osteoporosis International: Published 23 March 2026; https://doi.org/10.1007/s00198-026-07960-4.
30. LeBoff MS, Greenspan SL, Insogna KL, Lewieki EM, Saag Kg, Singer Aj, Siris ES, The clinician’s guide to prevention and treatment of osteoporosis; Osteoporosis International, 2022.
31. Chandran, M, Fracture Risk Assessment in Clinical Practice: Why Do It? What to Do It with? Journal of Clinical Densitometry, (20) 3: July-Sept. 2017, pp 274-279; https://doi.org/10.1016/j.jocd.2017.06.010.
32. EchoStudio V.2.0, User Manual, September 2020, Echolight S.p.A.
33. Francesco Conversano, Paola Pisani, Sergio Casciaro, Methodological Clarification and Analysis of Demographic and Anthropometric Determinants in the Calculation of REMS Bone Mineral Density; Calcified Tissue International (2026) 117:85. https://doi.org/10.1007/s00223-026-01547-1.